Ask your data anything

Questions in plain words, answers with charts. Your analytics finally speaks your language.
Analytics without the archaeology
Stop digging through reports for one number. Ask the question and get on with your day.
Plain-language questions
Ask why signups dipped or which channel grew fastest, the way you would ask a teammate.
Answers with charts
Responses come with the numbers and visuals behind them, not just a sentence to trust blindly.
One keypress away
Press C anywhere in your dashboard and the assistant opens, ready with your project's context.
Knows your revenue
Ask about income by channel or campaign and it answers from your connected payment data.
Digs through segments
Countries, devices, referrers, pages: it slices your traffic so you don't build the filter yourself.
Your data stays yours
The assistant reads your analytics to answer you, and your data is never shared or sold.
Understand your traffic clearly
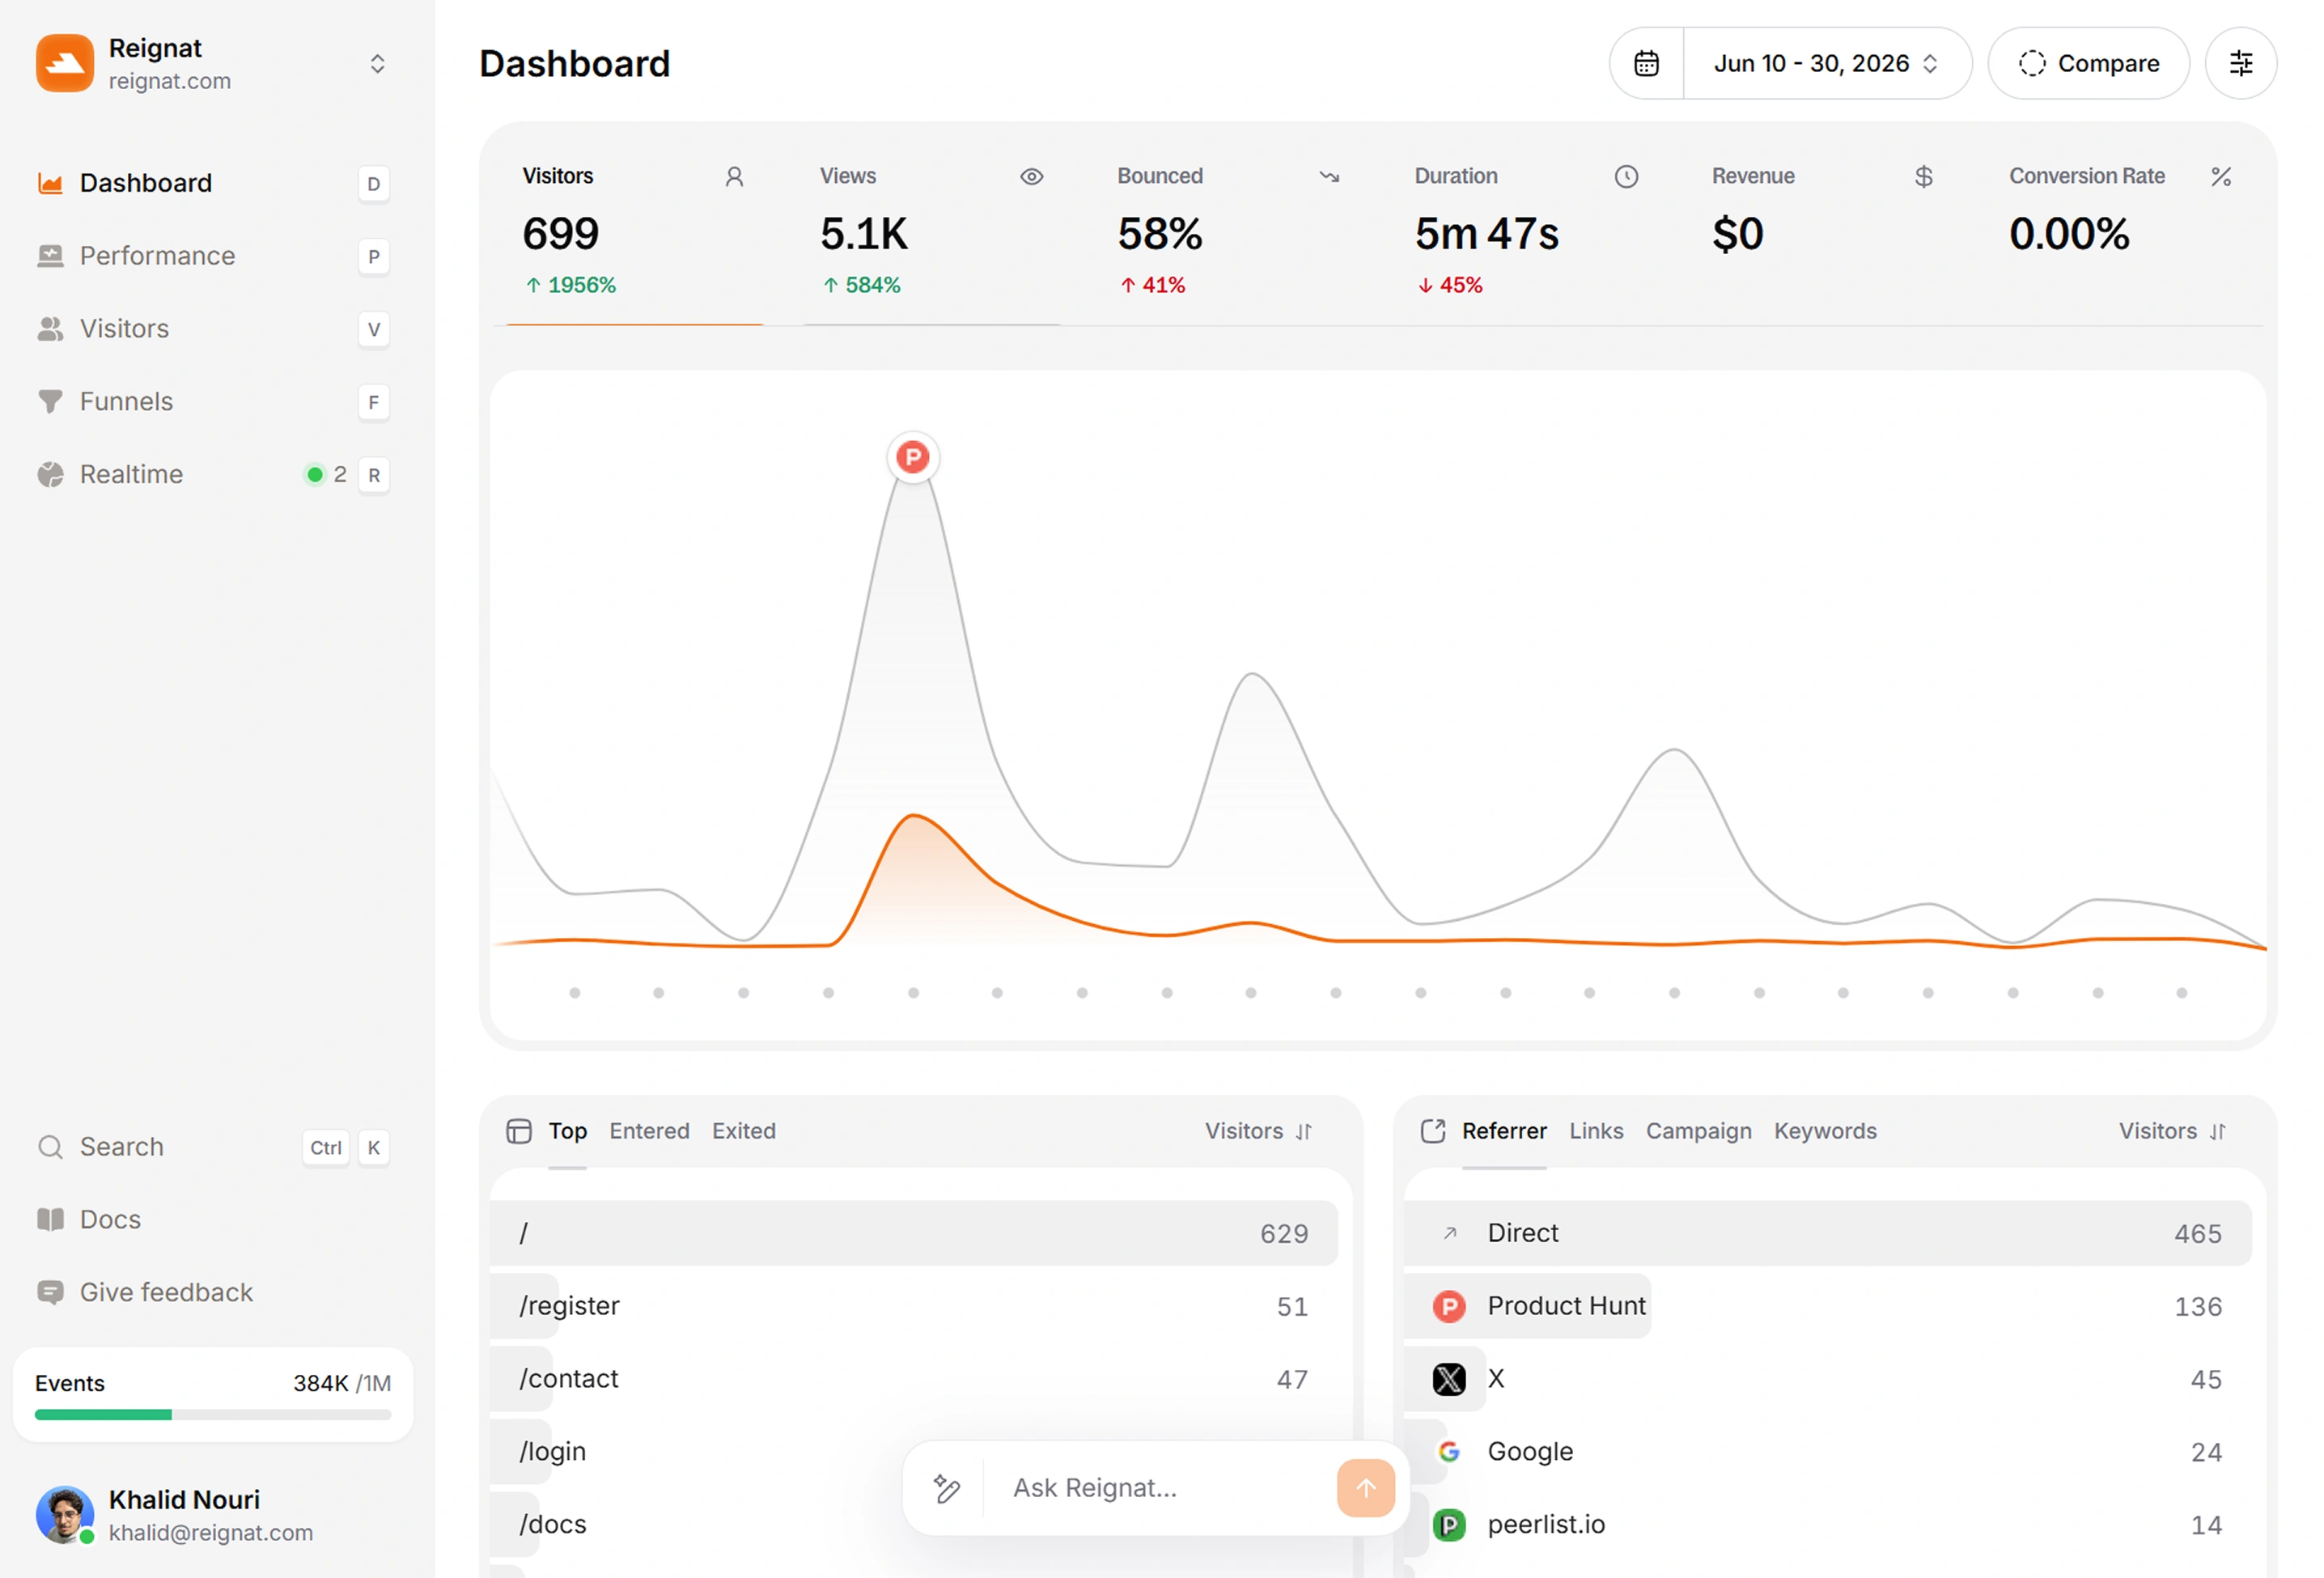
Your live traffic, visitor journeys, global reach, and site performance in one dashboard built to help you grow.
Revenue Attribution
Connect every sale back to the page, source, and campaign that earned it, so you know exactly where to invest.
Explore revenue attributionVisitor Profile
Follow each visitor from first click to conversion, with full journeys, sessions, and the moments that mattered.
See a live profileNo cookie banners
Reignat is cookieless and privacy-friendly by default. No consent banners and GDPR-compliant out of the box.
Go cookielessMonitor traffic from AI tools
See how much traffic ChatGPT,
Claude,
Perplexity and other AI assistants send your way.
Global Audience Insights
See the countries, cities, and channels your audience arrives from, and spot new markets as they emerge.
Watch traffic livePerformance
Track Core Web Vitals on every real page load and catch slow pages before they cost you visitors.
Check your vitalsExperience score
Funnels
Map the steps that matter, see exactly where visitors drop off, and fix the leaks that cost you conversions.
Find your drop-offsAI Assistant
Ask questions about your traffic in plain words and get instant answers, charts, and filters built for you.
Ask your data anything
Ready when you are.
Ask anything about your traffic, or start with one of these.
Frequently asked questions

Your next insightis one question away.
You are just a couple of minutes away from asking your first question. Join the teams who see their stats plain and true.