From side project to real business

One dashboard for traffic, conversion, and revenue. Check it with your morning coffee, then get back to building.
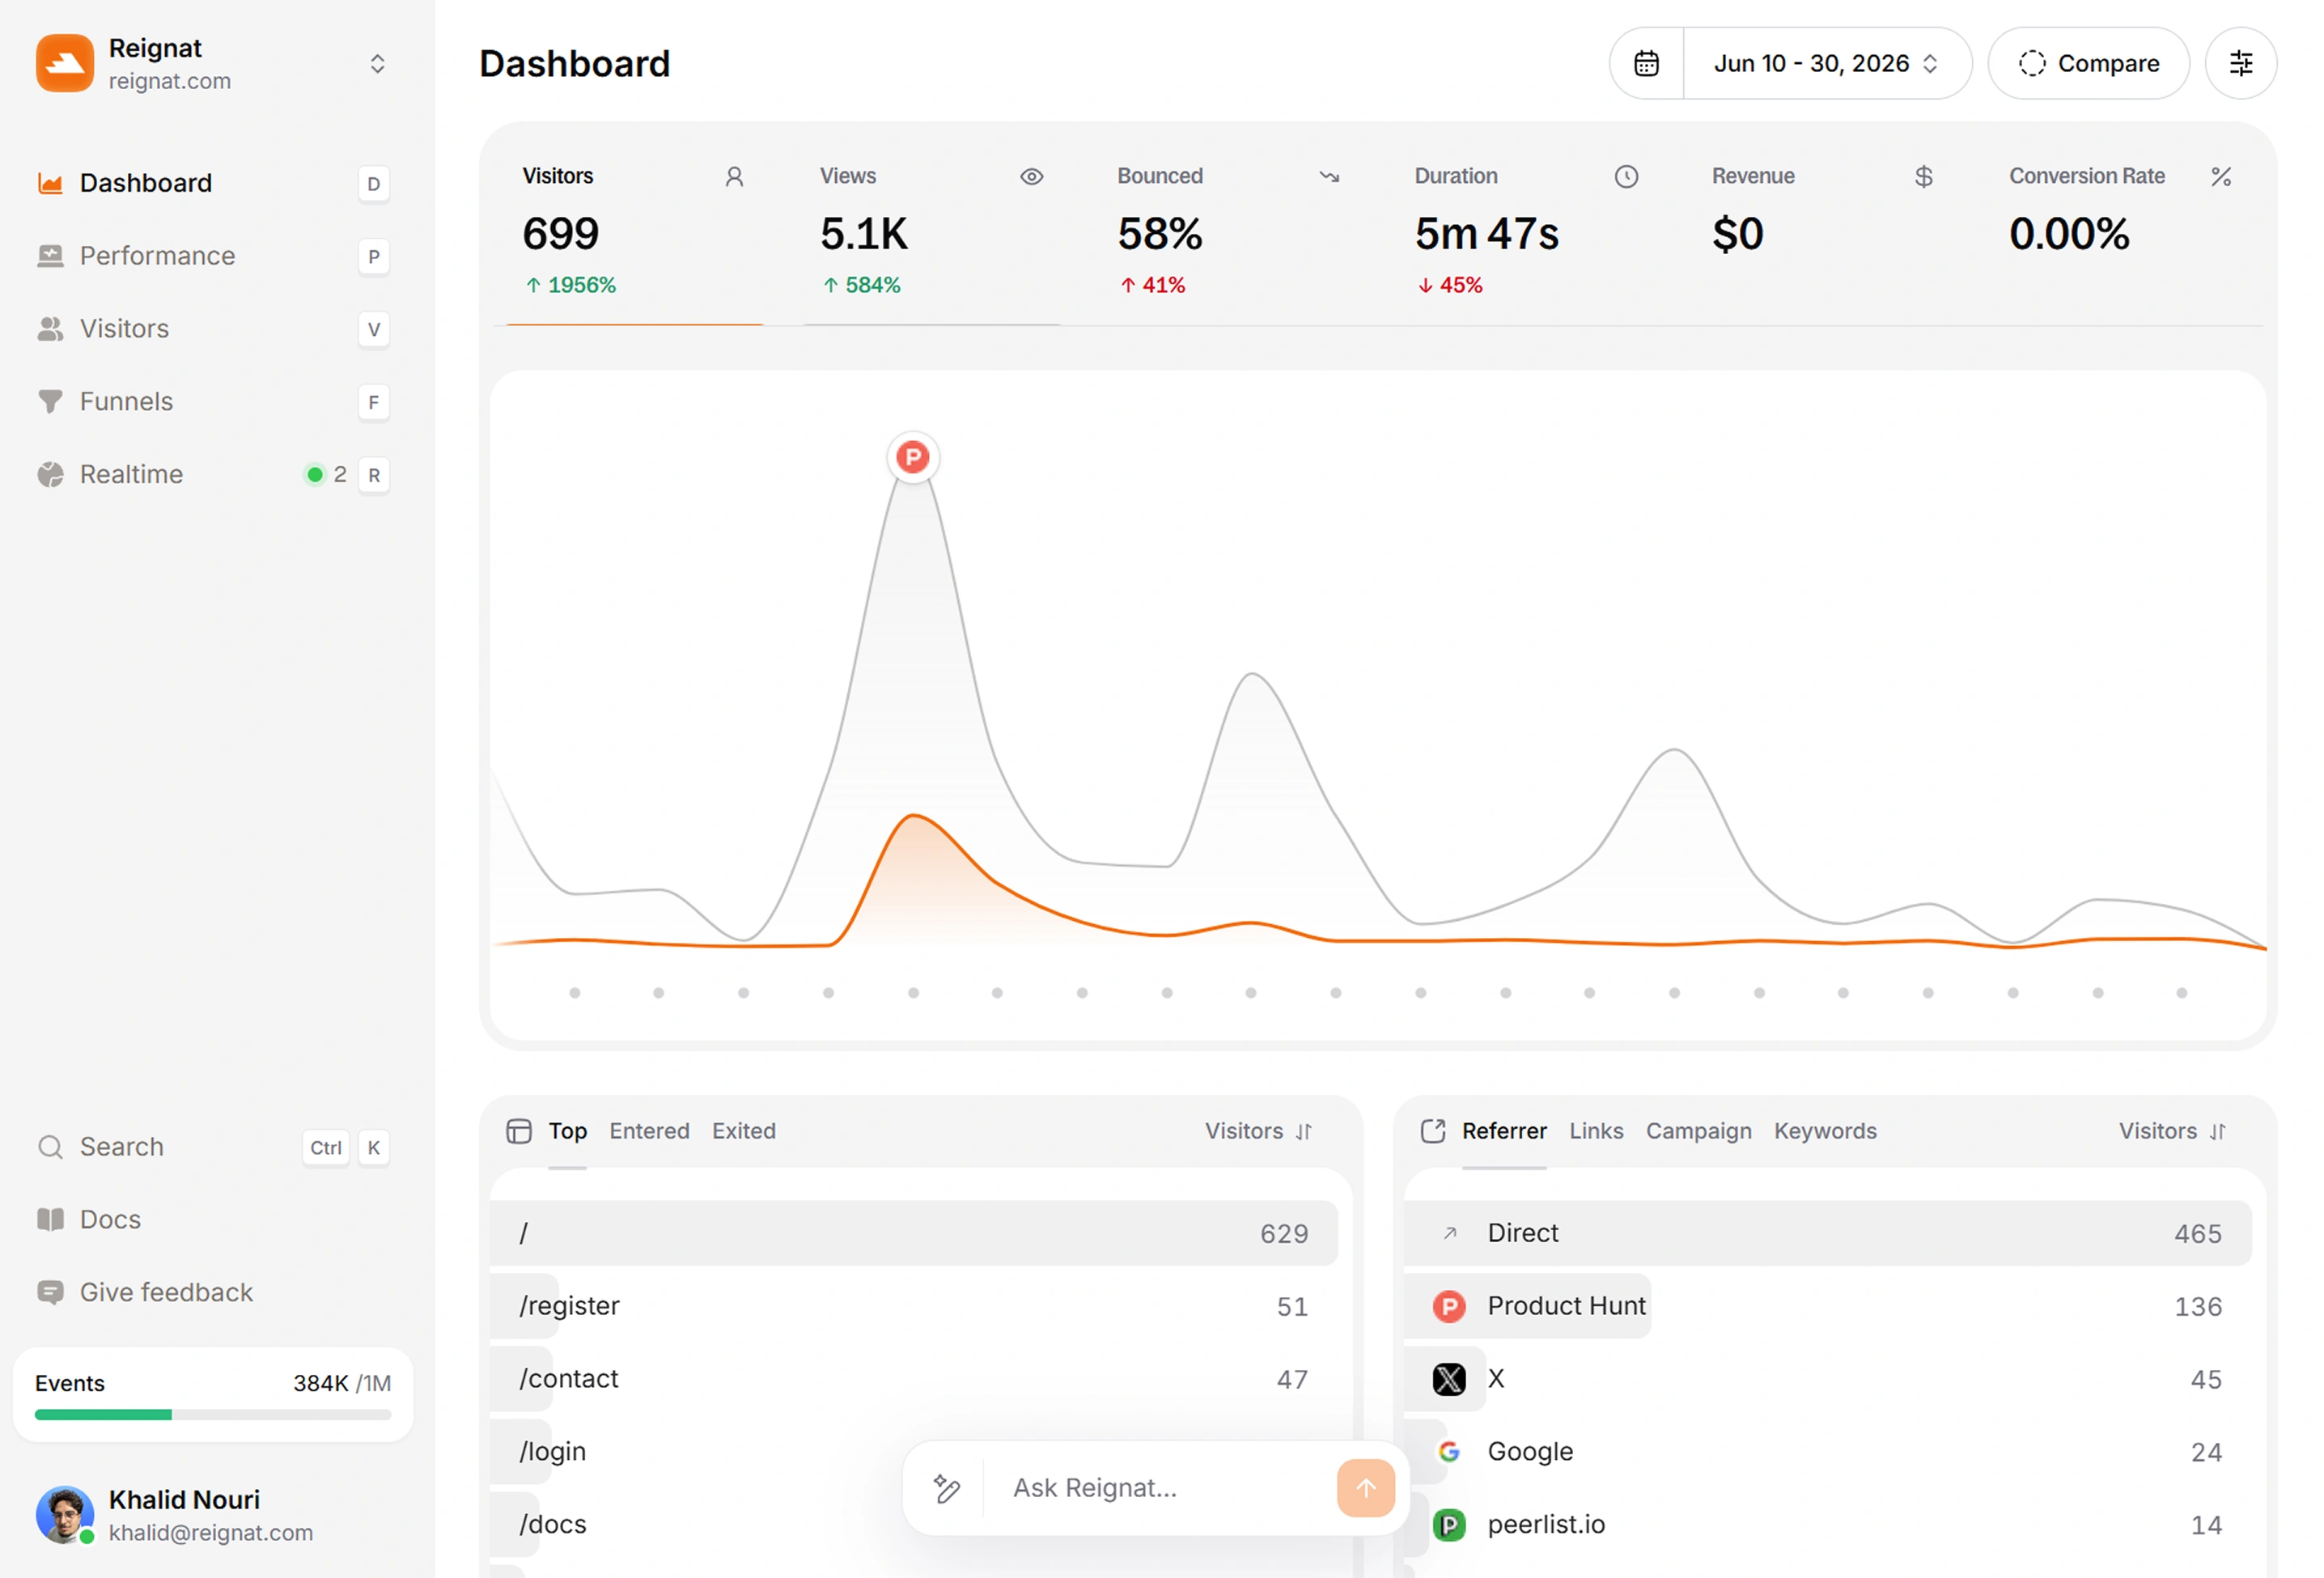
Everything you need to fly solo
Traffic, conversion, and revenue in one dashboard, sized for a team of one.
Revenue Attribution
See which of your launches, posts, and channels bring paying users, so you double down without guessing.
See revenue by channelVisitor Profile
Watch a stranger become a user, click by click, and learn what convinced them to sign up.
See a user journeyNo cookie banners
Reignat is cookieless and privacy-friendly by default. No consent banners and GDPR-compliant out of the box.
Go cookielessMonitor traffic from AI tools
See how much traffic ChatGPT,
Claude,
Perplexity and other AI assistants send your way.
Global Audience Insights
See where your users come from and watch launch-day traffic light up the globe in realtime.
Watch your launch livePerformance
Keep your landing page fast with Core Web Vitals from real visitors, no Lighthouse runs needed.
Check your vitalsExperience score
Funnels
Map landing page to signup to paid, find the leak, ship a fix, and watch the numbers move.
Find your drop-offsAI Assistant
Ask what happened to signups after your latest tweet and get an instant answer with charts.
Ask your data anything
Ready when you are.
Ask anything about your traffic, or start with one of these.
Built for how indie hackers actually ship
You are the developer, marketer, and support team. Reignat keeps the numbers one glance away.
Set up in one minute
Add one tiny snippet between deploys and your dashboard is live. No config files, no data pipeline, no weekend lost.
Revenue on the same screen
Connect Stripe or Polar and see traffic and income side by side, so you know if the launch actually paid.
Find what blocks signups
Build a funnel from landing page to signup and see exactly which step loses people, then fix it and ship.
Grows with every launch
From your first Show HN to 25M events a month on the same plan structure. No analytics migration, ever.
No cookie banners
Privacy-friendly tracking with no personal data stored keeps your landing page clean and conversion-ready.
Your analytics copilot
Ask why traffic spiked on Tuesday in plain words and get the answer with charts, without leaving the flow.
Frequently asked questions

Ship the next feature.We'll watch the stats.
You are just a couple of minutes away from bringing your dashboard to life. Join the indie hackers who see their stats plain and true.